Let’s Learn Vega!

What is Vega?

Vega is a tool for creating visualizations based on D3.js and JavaScript. For comparison, Vega is the D3.js equivalent to R’s ggplot2. While D3 visualizations require you to think of all of the possible aspects of the visualization, Vega allows for quick visualizations through data manipulation without needing to input all the little details that quickly become quite complicated. As with D3, Vega is creates a JSON visualization that is a representation of the data that is fed to it.

So what can we do with Vega?

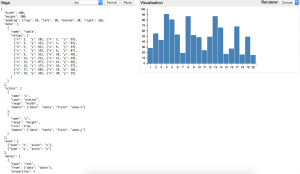
There are so many things that can be done with Vega! There is a live editor here, which gives you the basics of different types of visualizations you can do within Vega. The live editor gives examples, such as this, so you can see what types of visualizations can be created within Vega.

Screen Shot 2014-11-11 at 12.46.55 PM

As you can see, we have a sample visualization in the form of a bar chart, and we have the populated field of D3 information on the left that creates the visualization. Rather than having to hand code everything within Javascript, we are able to take the basics from their code and change things around to make our own visualization with our information.

Before we dive right into Vega, it’s important that we understand the different elements that are utilized within the data to create the visualization. If we look above, there are many different elements to the visualization. Scales, in the example of a bar chart, give us the background of where the data will go, where the axes give us the x/y axis we are used to, and marks fills in the data that we input.

Let’s try Vega!

For this section, we should work through how Vega actually works. For our purposes of understanding how it works, let’s make a simple bar chart. Using the code from the bar chart above, let’s make something of our own using the sarna.csv from the history data. (You will need access to the .html file, the .json file, and the sarna.csv file for this tutorial.)

First, you will need to start your local server so that we can create our visualization live. If you need assistance remembering how to start it, click here. (don’t forget to change directories into your working directory first!)

Open your local host (http://localhost:8000/), and go to your working directory. Within this, you’ll need the index.html file.

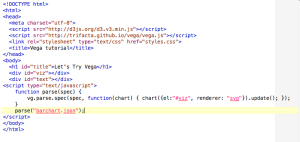
If you open the index.html file (or type in what is in the image below), we have a working file that will allow us to delve further into the world of Vega. You’ll notice that a few of the things are similar from the D3 tutorial that we know, but now we have inputted the Vega link. We also have functions that exist to explain where the completed Vega visualization will go.


Screen Shot 2014-11-12 at 5.19.05 PM


For example, here, the “el” function is mandatory. We must have it to make this work. However, you will see that I placed the item in the “viz” div, and it spits out an SVG. After, I have it understanding where the information will be pulled, which is our JSON file.

Let’s Talk Data in Vega

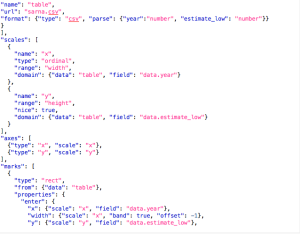
One of the most difficult elements to grasp in Vega is how to import your own data. Here is an example image of uploading our sarna.csv file. As you can see, there is a specific way of uploading your data files into the JSON to create a visualization. Most importantly, you need to locate the file you are using, you need to clarify which items are numbers (seen below with the year/number example), and make sure that whenever you’re seeking data within the JSON document, that you state where to pull from.

Screen Shot 2014-11-12 at 5.22.26 PM

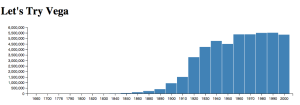
Once we have all of this put into the documents, it should populate a bar chart for us that looks like this (but interactive!) once you go to your local host site:

Screen Shot 2014-11-12 at 5.37.39 PM

From here, you can change minor details within the JSON document to create other bar charts. However, remember that Vega is not limited to bar charts! There are many types of visualizations that can be created through Vega. I encourage you to explore them all!
 

Continue Reading

Wrapping Up

This week, we discussed networks and crowds. As someone who has been interested in the utilization of crowds for the purpose of the historical record and memory (currently for my project, I am very interested in creating a memory archive of photographs, videos, and written memories from video gamers throughout the years), I felt like this week was right up my alley. 

Beyond the creation of a repository for the memories, it is also important to create something that is both interesting and useful to the public as well. My experience working with the Center for History and New Media has helped me to further understand more how to work with the public while also creating something that is fun and useful for the members of the public. (My background is originally in Public History, as my MA is in the topic from the University of Central Florida.)

Another aspect that is interesting to me is the idea of social networking for these projects. As we know, social networking immediately makes whatever visible that you post to them. For my Clio 2 project, I utilized social networking to gather memories. I feel that a greater reach through Twitter, Facebook, and even blogs will be important to get a wider range of responses. My project was a way of testing the waters, and I did get many more responses than expected. I will try to continue this line of thought for the dissertation.

I’ve learned a lot this semester, and I will continue to think along the lines of digital history and the field for the exam in the fall. I feel like i further understand the field in which I work, and that experience is so useful for my future as a historian.


Digital History Minor Field

I realized as I was writing my last blog post that I never explained fully what was going on with me and my blog. Currently, I am taking my readings course for my Digital History Minor Field. Every week, with my classmates, I read several theory works written regarding a topic in the field of digital history. 

If you’re interested in the readings that we discussed, the order of these topics, and some of the things that have been said, I have inserted a pdf of that information here. 

DigitalHistoryMinorField804

Every other week, I have been blogging about my thoughts on the topic, how i feel I could utilize some of these ideas, and where I think digital history and historians stand in the field. I’m almost at the end of the semester, and I have both discovered more regarding the field that I previously knew and thought about how this would apply to my future dissertation. (Which is important) Please feel free to go through the previous posts to see my thoughts.

Text Mining

Unlike some of the weeks of this course, text mining was something that we had actually done before. (For those interested, the results and process are here through several blog posts.) However, When we did that work in February, we (or at least me) were really new to text mining. Through Programming Historian, we were able to work our way through a version of text mining that gave us some sort of results. The problem with this process was that since we were new to the process, we 1.) missed a few technical steps and 2.) did not really get to read into some of the practicalities of text mining.

This week’s readings help to flesh out some of the missing pieces from the project, as well as understanding the complications, such as the double meanings of words and how words can be entirely different to work with than numbers. Historians, by nature, are very comfortable with working with words and discovering their underlying meanings throughout the context. However, there can be complications, such as dealing with figurative language. Traditionally, we read within the context to understand what these things mean. With a large corpus of texts, it can be useful, and sometimes even insightful, to see what types of patterns exist.

One of the issues that I ran into with topic modeling and the process is how to coax out silences that  historians are used to dealing with in historical texts. I am, however, unsure of how to represent those silences or predict where they would occur. 

Further, a common theme that has occurred in the readings for digital history is the need for legitimacy– to explain how these things work so non-digital historians might understand what we did. Ted Underwood states that we need to understand the black box behind text mining, such as the algorithms. However, we discussed in the class how monographs and historical work tends to cut out the methodology now. Why is it important for digital historians to explain their work, whereas traditional historians do not? I do feel that is important to understand the concepts and ideas behind topic modeling, but I feel that the constant need for explanation and legitimacy could potentially limit the projects that could emerge from digital history.

On Space

For the last class, we discussed how digital history influences how historians view space and connections. First of all, as I was going through a crazy move with my parents, space was definitely on my mind. Now that things have settled down a little, I’ve been able to think a little bit more clearly about what I want to say about space and digital history.

During the class, I proposed how it would be interesting for my research (for those of you stumbling upon this for whatever reason, that research is on video game history and masculinity.) I think the most intriguing connection that I came up with was how one game (Space War) was able to travel from MIT across the country through different computer science programs in the 1960s to influence future gaming developers, with the ultimate influences being Nolan Bushnell‘s first arcade attempt, Computer Space, and Space War gaming competitions.

Communication in the 1960s obviously was different, but due to the possibilities of digital history, it would be possible and exciting to specially map the travels of the game, as well as the different communication networks that it enabled between developers. 

Although the movement of the original game could be done through traditional mapping illustrations, I believe that the different environments, as well as the enhancements, networks, and communication would be much more useful in some type of digital environment that could show what was able to come from these connections beyond the obvious.

What Opportunities Do We Gain from Digital History?

This week, our readings focused on what digital history can add to the field. These elements including visualizations (which is a complicated concept, as we learned) and even extending history beyond the concept of finding your untouched archive and examining a limited amount of time and space. Digital history, from what I have seen this week and throughout my budding career, expands opportunities for historians and the field of history.

But one other aspect from this class is that these expansions from digital history can be problematic, or rather very, very complicated. Staley’s Computers, Visualization, and History was one of the works that I struggled with, as the idea of a visualization is still sort of unclear after all is said and done. Our discussions on virtual reality, augmented reality, and even illustrations makes it difficult to picture what this could look like. I feel that next week’s works on space may help put this into perspective.

Another aspect that I found very interesting this week was the importance of the visual to our culture. We discussed in class how images, movies, and anything visual has more impact in our culture today, and this is important to consider when we’re working on history in the future. How does/can the visual culture influence how we work? Is this important to consider with the visualizations and whatever else might appear in our works? I do not yet have the answer, but I am tentatively saying yes. I feel that visualizations could add a certain something element to my work, especially considering the visual nature of my research on video games.

If there is one thing that I am getting from this class, it is most certainly the fact that it is making me think and wrap my head around what all of this means. Since we are reading so many books about the opportunities of digital history and what can be done with it, it is very interesting to think about what can be done, what will be done, and how to do them. 


Narrative and Digital History

This week, many of our readings dealt with the concept of narrative and digital humanities. There seems to be, and as we know from many digital history projects, a disconnect between a historic narrative and tying this into a digital work.

Considering the type of project that I’m considering–a full or partially digital dissertation–I, too, just consider the implications of how to incorporate a narrative into digital work.

I feel that my future dissertation lends itself well to becoming something digital, as it is already a very visual-based topic. Many of the works we read this week examined what we can learn from video games, which led to many looks at me about my thoughts. Since video games are a massive (as in my topic and sources!) part of my topic, I feel it would be important to take lessons from video games in how to promote a historical narrative within a digital work. However, I have no idea how that would eventually look.

Honestly, I cannot tell you how I can fit these pieces together. I think about it a lot, and especially since I began working on this digital history minor field. We see that the history of the field is relatively short, but still 20+ years, so it makes it more difficult that there are not as many digital dissertations developed.

Just an FYI

I have not forgotten my blog post this week. I am still gathering my thoughts about my project and where it would fit into the digital world and why. Blog post forthcoming!

Final Tentative

Hello, everybody! I’ve been working on my final project, and here’s what I have so far. I need to shrink down the banner image, add in the actual links/text/images, as well as some other editing. Let me know if you have any suggestions! Here is a link.


I commented on Beth’s page this week.